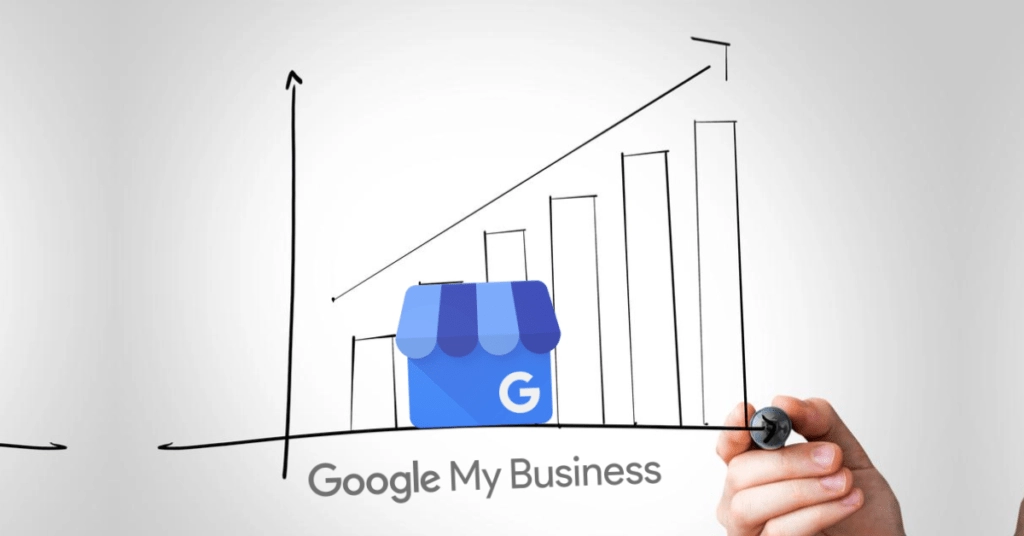
At Mobilosoft, we continuously monitor the impact of Google My Business for our customers. In this context, we decided to follow more than 10,000 points of sale more closely in the last few semesters. The goal is to be able to derive performance benchmarks, in order to measure the overall impact of local searches made on Google Search and Google Maps for the brands.
Find all important stats of the study by downloading our infographic

About the study:
This study covers more than 10,000 points of sale in 8 industries (Grocery / Bank & Insurance / Restaurant / Fashion / Home & Garden / Automotive / Health & Beauty Care / Technology) that are particularly active on Google My Business.
The results are quite surprising: over the last six months, Google has generated 70% more impressions compared to the same period in 2018.
Find the details of the stats to follow below, from impressions to In-store traffic and activations on the local pages of the establishments. Let’s go !
Evolution of the number of impressions per point of sale
On average, in this first half of 2019, each retail outlet studied is benefited from 118,658 impressions on Google Search or Google Maps, compared to 70,153 in the previous year.
It is interesting to note that, in the first quarter, growth is slightly larger in 2019 than in 2018, before suffering a slight decrease in April. However, this decrease is offset by a positive change in the number of impressions per point of sale in the months of May and June.
These results suggest that in 2019 consumers are spending more time looking for outlets on the Internet compared to a year ago.
Find all important stats of the study by downloading our infographic
Evolution of the number of activations per point of sale
Regarding the number of activations, we also see an increase for each point of sale. Although less marked than the number of impressions, a 35% increase in the number of activations can not be neglected. During the first half of 2019, the stores studied received an average of 1,467 activations through Google My Business. This stat is quite important, knowing that two years ago we only receive 954 activations over the same period.
This shows that Google Maps and Google Search have a growing impact on Web-to-Store activation. The number of searches is increasing and the number of actions resulting from this research is also increasing.
Importantly, while we discovered a decline in the number of searches in April, the number of activations is increasing over the month before undergoing a slight decline in May and significant recovery in June.
It is also interesting to note that the fastest growing type of activation is phone call. Between the first half of 2018 and the first half of 2019, the number of calls made from Google My Business to the point of sale has increased by almost 50%. This seems to be in line with the reason that consumers, who want to make sure before their point-of-sale trips, need accurate information from Google. For example, they call to make sure of the availability of a product or make sure that the stores are open during holidays.
Although Google is only a navigation tool, the number of requests for routes increases by 32.5% on an annual basis. The weakest growth comes from clicks that grow 28%.
Find all important stats of the study by downloading our infographic
Point of sale traffic
Beyond the classic KPIs that based upon impressions and activations, Mobilosoft has developed, in reference to the micro-conversion model created by Google, an algorithm that allows measurement of traffic generated in point of sale from Google My Business. This algorithm combines impressions and activations within a probabilistic model that indicates the traffic generated.
Based on this study, it is interesting to note that outlets are able to get more than 54% growth in point-of-sale traffic thanks to Google My Business. In the first half of 2019, on average, each outlet generates 2072 visits thanks to its presence in Google Search and Google Maps.
What should you remember?
Comparing the situation in the first half of 2019 with the same period on the previous year, we note that the impact of Google My Business for businesses, who organized its physical outlets connected with the social network, has increased significantly. First, outlets are increasingly searched for on Google Maps and Google Search. Then, the number of actions produced from this actions also increased.
Find all important stats of the study by downloading our infographic
Given the network density, especially in cities, it is important for retailers to step up their efforts in Google My Business. This involves three actions:
- Ensure to update outlets data continuously. Remember that Google regularly adds features in its tools and the more you fill in the information requested, the more you will be referred.
- Optimize review management. The prominent outlets in the first position are those who have the most quality reviews and respond to customer reviews.
- Publish local content through Posts and and fill out product catalog and / or menus if it’s available for your business.
Specifically: the more you give Google “clues” about the value of your outlets, the more impressions you will have and therefore the activations that will result in point-of-sale traffic!
Download your infographic now!

{{cta(‘ae3ae3c4-d7fc-43db-87c6-48dae6694e09′,’justifycenter’)}}
ou contact us!